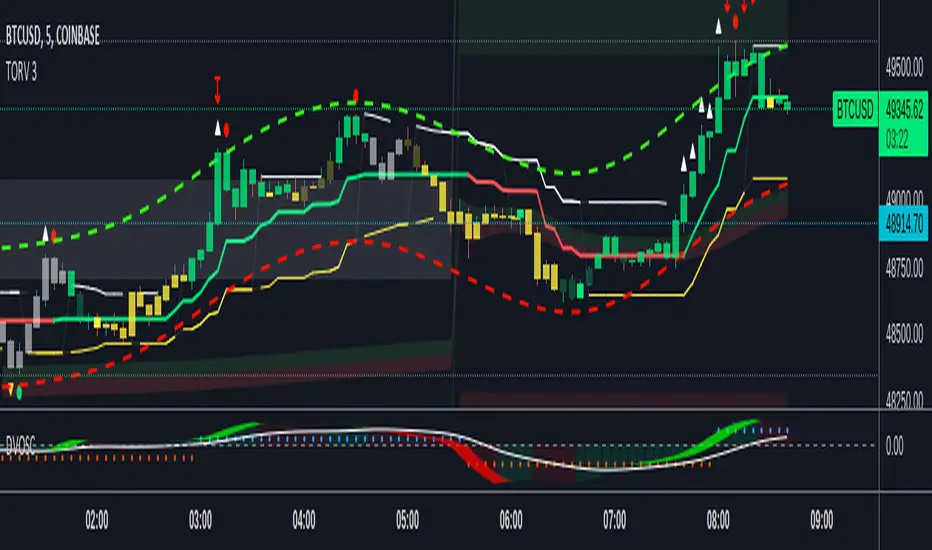
VWAP OscillatorToday I'm proposing a simple VWAP oscillator script to trade buy and sell waves more easily.
You trade this similar to how you trade Awesome Oscillator, so if you want an explanation just look up YT videos.
In addition to that, this will also show volume squeezes, please note that this is a makeshift way and not real volume squeeze phenomena of volume profile and tape. None the less, it is quite good at allowing you to ride out good trending waves and locate weak price action due to volume squeeze. You can turn off bar coloring from settings if you don't want this.
For ease of reading, I've also applied Allenstars Dynamic zones on this indicator so you can easily locate where the reading is entering in long and where it is in sell, this is compared to selected sample size. I've already selected the most common setting for that, so you don't really need to fiddle with it unless you find something better.
This indicator can be used to trade divergences as well, in fact, I feel it is better for that compared to RSI/MACD, the usual suspects.
Past performance is not assurance of future performance and this idea is published for only educational purposes, author taken no responsibility for your profit or loss.
חפש סקריפטים עבור "volume profile"
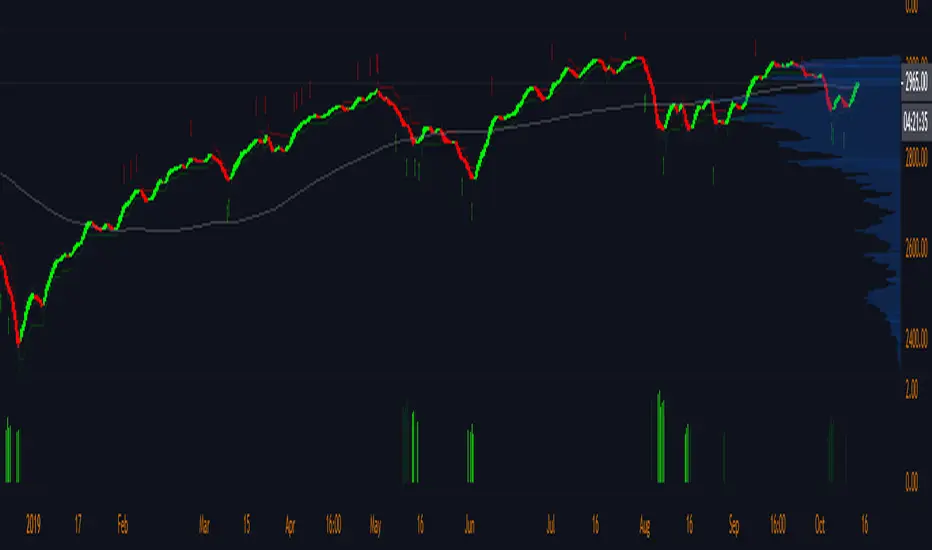
Pre-Market Volume ProfileThis indicator displays the pre-market volume (note: without the post-market of the previous day).
Unusual pre-market volume often indicates that institutional market makers are moving the market, which is a good sign for unusual high price movement.
The indicator helps me to spot stocks, if a pre-market gap is confirmed with enough (unusual) volume.
You can define, what "unusual" means by you, by adjusting the SMA length and the SMA multiplier.
The default is a length of 21 bars and a 2.5 multiplier, meaning I'm interested in a stock, if the pre-market volume exceeds the average pre-market volume by 2.5 times.

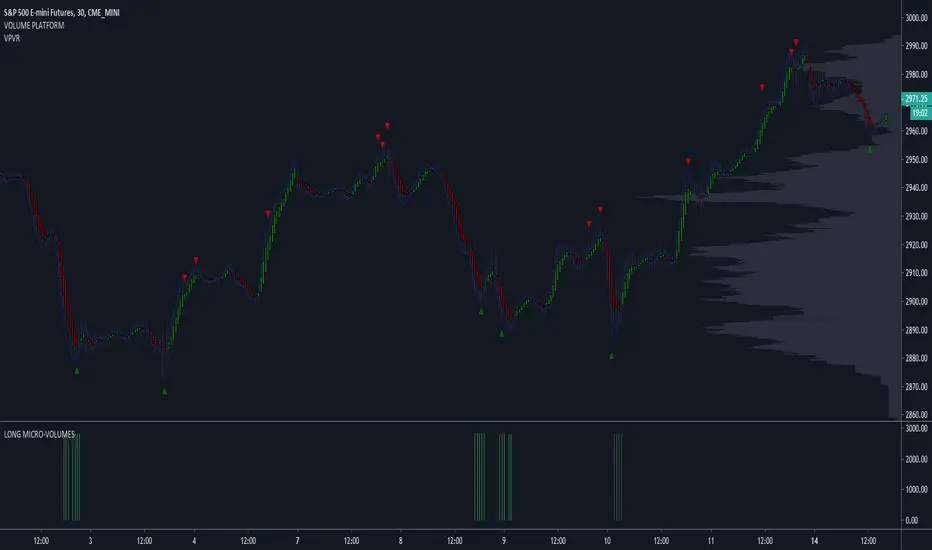
LONG MICRO-VOLUMES 3.0This script - when plotted below the chart - shows most important LONG VOLUMES during the sessions.
Volumes often anticipates turning points and/or show important support levels.
My advice is to plot volume profile too, to complete the view.
The script works with stocks, etf , commodities , futures , forex, spreads.
I use to trade with this tool looking at different time-frames in the same moment.
SHORT MICRO-VOLUMES 2.0This script - plotted on a panel above the chart - shows most important SHORT VOLUMES during the sessions.
Volumes often anticipates turning points and/or show important resistance levels.
My advice is to plot volume profile too, to complete the view.
The script works with stocks, etf , commodities , futures , forex, spreads.
I use to trade with this tool looking at different time-frames.

LONG MICRO-VOLUMESThis script - when plotted below the chart - shows most important LONG VOLUMES during the sessions.
Volumes often anticipates turning points and/or show important support levels.
My advice is to plot volume profile too, to complete the view.
The script works with stocks, etf, commodities, futures, forex, spreads.
I use to trade with this tool looking at different time-frames, in the same moment.
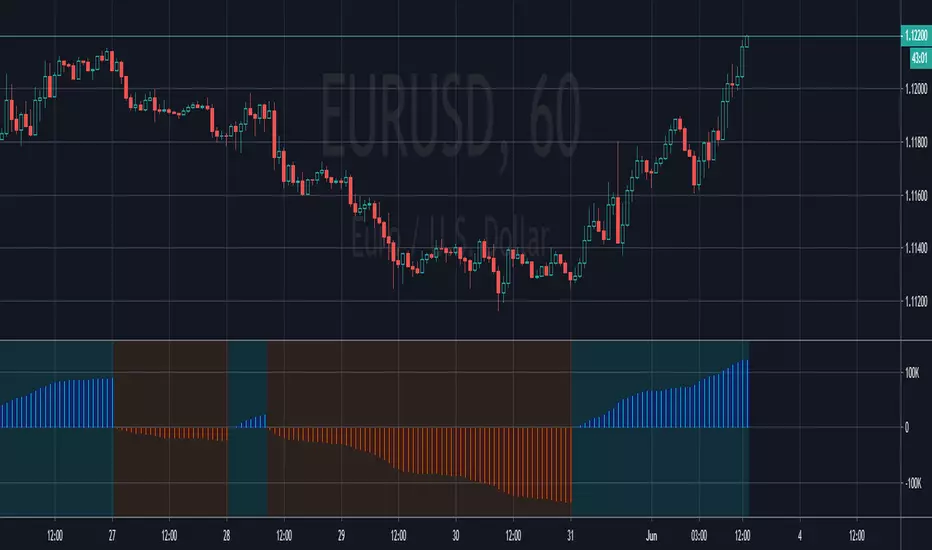
PpSignal Volume Profilethis indicator shows us the strength of the volume. green is buy signal an orange is sell signal.
The yellow signal is the net volueme. Net volume is a technical indicator calculated by subtracting a security's uptick volume by its downtick volume over a specified period of time.
when the volume buy is greater than the volume of sell the background change to aqua color. When the sell volume is greater than the buy volume, the background is painted orange ...
Angled Volume Profile [feeble]BETA VERSION
this indicator maps volume as brightness over an SMA. the brightness then fades over time.
It draws 30 bands, so you will need to load multiple instances to get a large picture.
Configure the settings, then copy and paste the indicator, modifying only the vertOffset attribute each time
Patience, bruh. This takes a long time load. Chrome runs it faster than Firefox. ¯\_(ツ)_/¯
Please let me know if you can think of how to optimize it.
Feedback is appreciated is you use it :)
sample with 6 instances:
settings:
useLog: enable if you are using a log graph
rowHeight: resolution of rows.
vertOffset: normally if you have 5 instances, the values will be -2,-1,0,1,2
fadeAmt: how long it takes for volume to fade once it is picked up
volumeMin and Max: the volume range displayed.
volumeResolution: time resolution at which volume data is collected - this is why the fadeAmt is so high, and why the graph runs out of data after a period back
EMA length: its Actually SMA but I wrote it wrong. eg. for a 20 day period on a 15min chart you go ( 20 days x 24 hrs x 4 quarter hours = 1920) - I hope to automate this in a future version :p

FHX Bands (VWMA BB)This study is an optimized version of Bollinger Bands based on volume weighted data points: more volume on a bar gives those prices a higher impact. FHX bands base on the assumptions of auction market theory (e.g., as does volume profiling). Bollinger Bands implicitly assume a uniform probability mass function for data points and consider only the - somewhat arbitrary - close price. In contrast to this, FHX bands take all four available data points into account (OHLC) and use the volume at each candle* to define a probability mass function in order to compute mean and standard deviation.
As an indicator, FHX bands could be used in the same way as BB to facilitate or confirm Break-Out trades and identify strong momentum moves. Settings for the standard deviation multiplier should be interpreted as follows (following the 68–95–99.7 rule):
x standard deviation set to 1: ~32% chance that a move outside the bands is by chance
x standard deviation set to 2: ~5% chance that a move outside the bands is by chance
x standard deviation set to 3: ~0.3% chance that a move outside the bands is by chance
This however assumes a fairly solid period of consolidation beforehand (visible through notable contraction of the bands) and a normal distribution of values within that consolidation period. Therefore users need to experiment within their time frame in order to identify a Length setting that suits their needs. Personally, I set Length to 21 or lower, depending on my targeted time frame. Note that the indicator does not test for normality in any way; you can, however, use a quick visual test using the fixed range volume profile indicator to increase its reliability.
Good luck and mind your risk
-fhx
* of course tick data would be the real deal, but we work with what we have
Market Structure BOS/CHoCH with Fibonacci ZonesThis invite-only indicator helps traders visualize market structure breaks , trend changes and Fibonacci-based zones in a clean and customizable way. It is built for educational and analytical purposes, combining classic price action concepts ( Higher Highs , Lower Lows , BOS , ChoCH ) with dynamic Fibonacci levels and trend/range zones.
Perfect for crypto (BTC/USD), forex, stocks or indices on higher timeframes (1H, 4H, Daily recommended).
Main Features – How to Read the Chart
1. Swing Points (HH – LH – HL – LL)
- Red dots & labels above highs: HH (Higher High) or LH (Lower High)
- Green dots & labels below lows: HL (Higher Low) or LL (Lower Low)
- These show the current market structure: bullish ( HH + HL ), bearish ( LH + LL ) or ranging.
- Toggle: Show HH / LH / HL / LL and Show Swing Dots
2. BOS & ChoCH Breaks
- Horizontal cyan lines mark broken swing levels.
- BOS label (Break of Structure) = trend continuation (usually in the middle of the line).
- ChoCH label (Change of Character) = potential reversal (appears at the break point when trend flips).
- Colors:
- Strong break (white/cyan text) → confirmed by volume spike, ATR close beyond level, MACD direction and no big gap.
- Weak break (gray/orange text) → lacks confirmation (possible fakeout).
- Toggle: Show BOS / ChoCH
- Filter strength: Filter Breaks with ATR / Volume / MACD / Gap (recommended on)
3. Internal Fibonacci Levels of the Last Swing Range
- Solid lines inside the current swing:
- 0.382 (turquoise)
- 0.5 (gray)
- 0.618 (turquoise)
- Very useful for pullback entries, targets or invalidation levels inside ranges.
- Toggle: Show Internal Fibonacci of Last Range
4. Current Swing Range (Yellow Dotted Lines)
- Yellow dotted horizontal lines show the high and low of the most recent swing.
- Helps identify consolidation zones and breakout levels in real time.
- Toggle: Show Current Range (Yellow Dotted Lines)
5. Fibonacci Trend & Range Zones (Filled Areas)
- Dynamic fills based on highest/lowest of last X bars (Fibonacci Zone Period – default 21):
- Cyan fill (top) = Up Trend Zone (price above 0.236 Fib)
- Gray fill (middle) = Ranging / Neutral Zone (between 0.382 and 0.618 Fib)
- Orange fill (bottom) = Down Trend Zone (below 0.764 Fib)
- Quick visual: cyan = bullish bias, orange = bearish bias, gray = chop/range.
- Toggle: Show Fibonacci Zones
Examples – Refer to the Attached Chart Snapshots
TradingView shows several snapshots on this script page. Use the arrows to view them all:
Bearish structure in BTC/USD. Multiple LL and LH labels, repeated BOS breaks downward (green circles), orange down-zone dominating. Weak ChoCH attempts in orange during fakeouts. Yellow range lines tested around 68k–71k.
Deep decline with strong BOS continuations and LL labels. Notice how the orange zone expands during momentum moves and gray ranging zone appears briefly before next leg down.
Bullish reversal example with HH labels, ChoCH label (potential trend change), and cyan up-zone activation. Internal Fib levels (0.382/0.5) act as pullback zones during recovery.
These examples show how the indicator behaves in trending, ranging and reversal scenarios.
Important Notes
- Pivots can repaint in real-time (normal behavior of ta.pivothigh/low) → best used on closed bars or higher timeframes.
- No buy/sell arrows, no alerts, no strategy – this is a visual tool only.
- Filters are optional: turn them off for cleaner/raw structure view.
- Combine with your own confluence (order blocks, liquidity, volume profile, etc.).
- Not financial advice. Past performance ≠ future results. Use at your own risk.
Access granted case-by-case. Questions and feedback welcome in comments after access.

TrendFib Pro [KhedrFX]Automatic Fibonacci Indicator for TradingView: Real-Time Retracement, Extension & XABC Pattern Tool
TrendFib Pro is a powerful automatic Fibonacci indicator for TradingView that detects recent swing highs and lows in real time to plot precise Fibonacci retracement and extension levels. It combines dynamic swing identification with standard Fibonacci ratios and projects an XABC pattern structure — highlighting key B retracement zones (0.382 or 0.5) and a forward dashed C target — to reveal high-probability confluence areas for trend continuations, pullbacks, and reversals.
This TradingView Fibonacci tool eliminates manual drawing, providing crystal-clear levels and visual aids for faster decision-making across any market (Forex, Crypto, Stocks, Gold, Indices) and timeframe (1-minute to monthly).
Core Features & Underlying Concepts
- Dynamic Swing Detection: Automatically identifies the latest major swing high/low using an adjustable lookback period (default 50 bars) for accurate, real-time auto Fib levels without repainting after confirmation.
- Complete Fibonacci Suite: Plots essential retracement levels (0, 0.236, 0.382, 0.5, 0.618, 0.786, 1) and extension targets (1.272, 1.414, 1.618) based on detected swings ideal for Golden Pocket (0.618 area) bounces and trend continuation setups.
- XABC Pattern Projection: Recognizes potential X-A-B-C formations, validates B retracement depth, and projects a future C target (dashed line) to anticipate explosive moves or reversals after pattern development.
- Visual Confluence Zones: Semi-transparent background boxes highlight high-probability areas (e.g., around 0.5, 0.618, or extensions) for instant visual recognition.
- Customizable Display: One-color mode, adjustable line styles (solid/dashed/dotted), thickness, left/right extensions, label positions (left/middle/right), and price/percent labeling options.
- Info Table: Quick summary of recent XABC-related prices on the last bar for at-a-glance analysis.
- Performance Optimized: Limits drawing objects (~500 max) to ensure smooth chart performance.
This dynamic Fibonacci tool stands out by merging automatic detection, full Fib suite, and basic pattern projection into one non-repainting indicator — saving time while spotlighting confluences where Fibonacci levels align with potential XABC structures.
How to Use TrendFib Pro for Pullback Trading, Reversals & Extensions
The indicator auto-adapts to your chart timeframe — simply switch and see updated Fibonacci retracement TradingView levels and projections.
- Scalping / Intraday (1m–15m) : Use shorter lookback (20–30 bars) for quick swings in volatile markets. Target shallow pullback trading Fib entries at 0.382, 0.5, or 0.618 in strong trends. Monitor XABC C-target for short momentum bursts.
- Day Trading (30m–4h) : Default 50-bar lookback excels here. Hunt bounces at Golden Pocket Fibonacci (0.618–0.65) or 0.5 retests. Use extensions (1.272+) for take-profits and XABC projections for intraday targets.
- Swing / Position Trading (Daily–Weekly) : Extend lookback (80–150 bars) for major swings. Focus on shallow pullbacks (0.236/0.382) in trends or deep 0.786 reversals. Extensions become multi-day targets; XABC often signals key turning points.
Multi-Timeframe Confluence Strategy
Start on higher timeframes (Daily/4h) for trend bias and primary Fib zones, then drop to your trading timeframe for entries where levels cluster (e.g., higher-TF 0.618 + lower-TF 0.5). This alignment dramatically boosts setup probability.
⚠️ Trade Responsibly
TrendFib Pro (TFPro KFX) is a professional-grade analytical tool — not a guaranteed profit machine. For best results, combine it with solid risk management and complementary indicators such as RSI, MACD, or Volume Profile. Trading involves significant risk of loss — always use proper position sizing, stop losses, and backtest thoroughly before live trading.

Institutional Volume Terminal[IVT Elite] v12INSTITUTIONAL VOLUME TERMINAL ELITE v12.3.1
The most comprehensive institutional trading system on TradingView.
🎯 CORE FEATURES:
VOLATILITY COMPRESSION
Detects "coiled spring" setups using Bollinger Band Width percentile analysis.
Shows compression strength 0-100% and duration tracking.
BREAKOUT DIRECTION BIAS ⭐ UNIQUE
Predicts breakout direction BEFORE it happens using 4-factor analysis:
→ Momentum drift during compression
→ Delta accumulation (institutional positioning)
→ VWAP positioning
→ Multi-AVWAP alignment
Result: 🟢 Bullish or 🔴 Bearish bias with confidence % (60-90% accuracy)
MULTI-AVWAP CONVERGENCE
Tracks 3 institutional anchors simultaneously (swing, mid-term, long-term).
When all converge = institutional consensus = high-probability zone.
STATISTICAL DIVERGENCE GRADING
Grades CVD divergences by standard deviation (>2σ = STRONG, 1-2σ = MODERATE, <1σ = WEAK).
Shows only STRONG divergences on chart = 90% noise reduction.
17-POINT CONFLUENCE SYSTEM
Volume spike, liquidity sweeps, POC proximity, divergences, convergence,
compression, bias alignment. Score 7+ = high conviction trade.
VOLUME PROFILE
POC (Point of Control), Value Area (70%), HVN detection, swing-anchored updates.
3-TIER EXIT SYSTEM
Automated targets: SD1 (33%), POC (33%), SD2 (34%) with trailing stops.
📘 INCLUDES:
→ 47-page professional handbook
→ 3 preset configurations (Crypto/Forex/Stocks)
→ Real-time dashboard (12 metrics)
→ Performance optimization modes
🎓 BEST FOR:
4H Crypto Swing Trading (3-5 signals/week)
1H Forex Scalping (10-15 signals/week)
Daily or 4H Stock/Index Trading (3.5 signals/week)
⚠️ NOT FOR: <15min scalping, complete beginners
Created by Jesper - IVT and institutional trading educator

HVN Boundary Assist FRVP + ATR Tempo Auto TF Defaults (LOCKED)This indicator is a structure-assist tool, not a signal generator. It is designed to standardize High-Volume Node (HVN) boundary placement and evaluation when using TradingView’s Fixed Range Volume Profile (FRVP) on weekly and monthly timeframes.
The script does not attempt to discover HVNs automatically. The trader selects the HVN visually using FRVP and inputs the HVN center (effective VPOC). From there, the script applies consistent, rules-based logic to define boundaries, track interaction, and prevent lower-timeframe levels from conflicting with higher-timeframe structure.
What the indicator does
1. Standardizes HVN boundary placement
Using the active timeframe’s ATR, the indicator identifies the first candle that regains tempo on each side of the HVN center.
A valid boundary requires:
A bar range ≥ a fixed fraction of ATR
A close that breaks prior rotational overlap
The close of that candle becomes the candidate HVN high or low. Wicks are ignored for structure.
2. Automatically adapts to timeframe
The indicator enforces locked system defaults:
Weekly: 0.33 ATR expansion, 10-bar overlap lookback
Monthly: 0.25 ATR expansion, 8-bar overlap lookback
These values adjust automatically based on chart timeframe, eliminating discretionary tuning.
3. Tracks retests without redefining structure
HVN interaction is tracked via wick touches within a tight ATR-based tolerance.
Retests are informational only and never move boundaries. This captures recognition and rejection behavior without violating close-based structure rules.
4. Ranks HVN strength (0–3)
Each HVN is scored using:
Tightness relative to ATR
Relative volume confirmation
Presence of at least one retest
This produces a simple, comparable strength ranking without overfitting.
5. Enforces clean monthly → weekly nesting
An optional monthly gate restricts weekly logic to operate only inside a defined monthly HVN.
If conflicts arise, monthly structure always overrides weekly, preventing level overlap and structural ambiguity.
What the indicator does NOT do
It does not read FRVP data (TradingView limitation)
It does not auto-detect HVNs
It does not generate trade signals
It exists to remove subjectivity and inconsistency from HVN boundary placement and evaluation.
Intended use
Apply FRVP and visually identify the HVN
Enter the HVN center price into the indicator
Let the script define precise boundaries and interaction metrics
Use monthly HVNs as structural rails and weekly HVNs for execution
Design philosophy
Structure is defined by closes and volatility, not wicks
Retests measure recognition, not acceptance
Higher timeframe structure always dominates
This tool enforces those rules mechanically so the trader doesn’t have to.

Group 0HVN Boundary Assist FRVP + ATR Tempo Auto TF DefaultsThis indicator is a structure-assist tool, not a signal generator. It is designed to standardize High-Volume Node (HVN) boundary placement and evaluation when using TradingView’s Fixed Range Volume Profile (FRVP) on weekly and monthly timeframes.
The script does not attempt to discover HVNs automatically. The trader selects the HVN visually using FRVP and inputs the HVN center (effective VPOC). From there, the script applies consistent, rules-based logic to define boundaries, track interaction, and prevent lower-timeframe levels from conflicting with higher-timeframe structure.
What the indicator does
1. Standardizes HVN boundary placement
Using the active timeframe’s ATR, the indicator identifies the first candle that regains tempo on each side of the HVN center.
A valid boundary requires:
A bar range ≥ a fixed fraction of ATR
A close that breaks prior rotational overlap
The close of that candle becomes the candidate HVN high or low. Wicks are ignored for structure.
2. Automatically adapts to timeframe
The indicator enforces locked system defaults:
Weekly: 0.33 ATR expansion, 10-bar overlap lookback
Monthly: 0.25 ATR expansion, 8-bar overlap lookback
These values adjust automatically based on chart timeframe, eliminating discretionary tuning.
3. Tracks retests without redefining structure
HVN interaction is tracked via wick touches within a tight ATR-based tolerance.
Retests are informational only and never move boundaries. This captures recognition and rejection behavior without violating close-based structure rules.
4. Ranks HVN strength (0–3)
Each HVN is scored using:
Tightness relative to ATR
Relative volume confirmation
Presence of at least one retest
This produces a simple, comparable strength ranking without overfitting.
5. Enforces clean monthly → weekly nesting
An optional monthly gate restricts weekly logic to operate only inside a defined monthly HVN.
If conflicts arise, monthly structure always overrides weekly, preventing level overlap and structural ambiguity.
What the indicator does NOT do
It does not read FRVP data (TradingView limitation)
It does not auto-detect HVNs
It does not generate trade signals
It exists to remove subjectivity and inconsistency from HVN boundary placement and evaluation.
Intended use
Apply FRVP and visually identify the HVN
Enter the HVN center price into the indicator
Let the script define precise boundaries and interaction metrics
Use monthly HVNs as structural rails and weekly HVNs for execution
Design philosophy
Structure is defined by closes and volatility, not wicks
Retests measure recognition, not acceptance
Higher timeframe structure always dominates
This tool enforces those rules mechanically so the trader doesn’t have to.

MASU+ Institutional: Trade Like the Smart MoneyMASU+ Institutional is not just an indicator—it is a complete trading ecosystem. It combines Smart Money Concepts (SMC), Order Flow Analysis, and Multi-Timeframe Logic into a single, powerful "Head-Up Display" (HUD).
Stop cluttering your charts with dozens of lagging indicators. MASU+ filters out the noise and reveals where the institutions are actually stacking their orders.
Key Features
1. The Institutional Dashboard (HUD)
Located in the bottom-right corner, this is the brain of the system. It analyzes the market in real-time to give you a clear "Go / No-Go" status:
Confluence Score (0-5): An algorithmic rating of the current setup. The higher the score, the higher the probability.
Trend Alignment: Scans the 15m, 1H, and 4H trends instantly. Only trade when the timeframes agree.
Volume Pressure: Detects whether Buyers or Sellers are in control of the order flow.
Risk/Reward Calculator: Automatically displays the R:R ratio for the current signal.
2. Smart Money Concepts (SMC)
Professional-grade automated mapping of institutional levels:
Order Blocks (OB): Highlights institutional supply and demand zones (Green/Red boxes).
FVG (Fair Value Gaps): Identifies imbalances where price is likely to return.
Liquidity Sweeps (x): Marks areas where "Stop Hunts" have occurred—perfect for reversal entries.
BOS / CHoCH: Real-time Break of Structure detection.
3. Market Regime Filter (The Cloud)
The background color tells you the state of the market instantly:
Green: Bullish Trend (Longs Only).
Red: Bearish Trend (Shorts Only).
Gray (No-Trade Zone): Choppy/Ranging Market. The system detects low-volatility noise and helps you avoid false breakouts.
4. Order Flow & Volume
See what is happening inside the candles:
VWAP Bands: Institutional dynamic support/resistance levels.
Volume Profile (POC): The "Point of Control" for the current range.
CVD Analysis: Confirms trends with Cumulative Volume Delta.
How to Trade (The Strategy)
LONG Entry (Buy):
Background: Turns Green (Trend is Bullish).
Price Action: Price tests a Bullish Order Block or support level.
Signal: A Green Triangle ▲ appears.
Confirmation: Dashboard shows Confluence Score ≥ 3/5.
SHORT Entry (Sell):
Background: Turns Red (Trend is Bearish).
Price Action: Price rejects a Bearish Order Block or resistance.
Signal: A Red Triangle ▼ appears.
Confirmation: Dashboard shows Confluence Score ≥ 3/5.
Exits (Take Profit / Stop Loss): The indicator automatically plots suggested levels on the chart:
TP Line (Green): Dynamic Take Profit based on Volatility (ATR).
SL Line (Red): Validated Stop Loss level.
Fully Customizable
Every trader is unique. You can toggle every feature in the settings:
Enable/Disable SMC (Order Blocks, FVG).
Adjust Signal Sensitivity (Scalping vs Swing).
Choose specific Correlation Assets (e.g., compare SPX500 with VIX).

Quarterlytheory Candles [Fractal Edition Pro+] by aamirlangQuarterlytheory Candles - by aamirlang
Overview
Quarterlytheory Candles is a comprehensive multi-timeframe Smart Money Concepts (SMC) indicator designed for precision trading based on quarterly theory, institutional order flow, and advanced market structure analysis. This indicator combines Higher Timeframe (HTF) candle visualization, liquidity sweeps, market structure shifts, Fair Value Gaps (FVGs), and Smart Money Tool (SMT) divergences to provide traders with institutional-level insights.
Core Features
1. HTF Candles with Quarter-Based System
Adaptive Timeframe Selection: Automatically calculates optimal Higher Timeframe based on your chart timeframe
1m chart → 23m HTF (Q1-Q4 quarters)
5m chart → 90m HTF (Q1-Q4 quarters)
15m/60m chart → 360m/6H HTF (Asia/London/NY AM/NY PM sessions)
Daily chart → Weekly/Monthly HTF
Weekly chart → Monthly/Quarterly HTF
Visual HTF Candle Display:
Shows up to 50 HTF candles with customizable offset
Bullish/Bearish body and wick coloring
Real-time candle formation with live updates
Quarter labels (Q1, Q2, Q3, Q4) or session names (Asia, London, NY AM, NY PM)
Countdown timer showing time remaining in current HTF period
HTF Open Line: Displays the opening price of each HTF candle with customizable style
HTF Fair Value Gaps: Identifies imbalances (BISI/SIBI) on HTF candles
2. C2 Setup Detection
The cornerstone of this indicator - identifies high-probability reversal setups:
C2 Buy Signal: Occurs when HTF candle sweeps previous HTF low and closes back above it
C2 Sell Signal: Occurs when HTF candle sweeps previous HTF high and closes back below it
C2 Confirmation System:
CISD Pattern (Change In State of Delivery): Validates sweep with price reclaiming CISD level
Multi-Period Validation: Confirms setups within 2 HTF periods
C3 Box: Shows HTF open to previous HTF EQ (50% level)
C4 Setup: Secondary setup when C3 EQ is favorable relative to HTF open
Standard Deviation Levels: Automatically calculates extension targets (-1, -2, -2.5, -4, -4.5)
Visual Elements:
C2/C4 labels with transparent backgrounds
T-Spot boxes highlighting setup zones (bullish=green, bearish=red)
CISD confirmation lines
Setup invalidation tracking (XC2/XC4 labels when stop hit)
3. Current Range Tool (CRT)
Displays three critical levels from the most recently closed HTF candle:
HTF High (red dotted line)
HTF EQ/Midpoint (gray dotted line)
HTF Low (green dotted line)
These levels serve as key support/resistance and targets for current HTF period.
4. Market Structure Shifts (MSS)
Automatically detects bullish and bearish market structure breaks
Uses fractal-based swing detection (customizable period: 1-15)
Color-coded MSS lines (blue=bullish, red=bearish)
Labels mark precise MSS points
5. Fair Value Gaps (FVG)
Bullish FVGs (BISI - Buy Side Imbalance Sell Side Inefficiency): Blue zones
Bearish FVGs (SIBI - Sell Side Imbalance Buy Side Inefficiency): Red zones
Mitigation Tracking: Changes to gray when price taps the zone
Automatically manages up to 50 FVGs (configurable)
6. Confirmed HTF Swing Levels
Draws horizontal lines at confirmed swing highs/lows
Confirmation Logic: HTF candle sweeps a level AND next candle closes with rejection
Lines extend for customizable overshoot bars
Useful for identifying swept liquidity levels
7. LTF Sweep Detection
Identifies when HTF candles sweep previous HTF candle highs/lows
Draws sweep lines on main chart at swept levels
Helps visualize liquidity grabs in real-time
8. Trading Sessions & Killzones -
Highlights key institutional trading sessions:
Asia Session (18:00-00:00 NY time) - Gray
London Session (00:00-06:00 NY time) - Red
NY AM Session (06:00-12:00 NY time) - Green
NY PM Session (12:00-18:00 NY time) - Blue
Session Features:
Customizable box colors and transparency
Session high/low pivot lines
Pivot labels with optional price display
Session open lines ("True Day/Asia/London/NY Open")
Days of week labels (MON, TUE, WED, etc.)
Daily/Weekly/Monthly open lines and high/low pivots
9. Smart Money Tool (SMT) Divergences
Compares your chart with two other symbols to identify divergences:
Symbol 1 (default: TVC:DXY - US Dollar Index)
Symbol 2 (default: OANDA:GBPUSD)
10. Information Tables
Two customizable watermark tables:
Info Table: Shows ticker, LTF, HTF, countdown timer, and bias
Personal Table: Customizable inspirational message
How to Use This Indicator
Getting Started
Add to Chart: Apply indicator to your preferred timeframe (works best on 1m, 5m, 15m, 60m, Daily)
Review HTF Candles: Check the HTF candles displayed on the right side with quarter/session labels
Monitor CRT Levels: Watch the dotted High/EQ/Low lines from previous closed HTF candle
Wait for C2 Setup: Look for C2 labels appearing after HTF sweep + CISD confirmation
Trading the C2 Setup
For Long Positions (C2 Buy):
Wait for HTF candle to sweep previous HTF low (price goes below previous HTF low)
HTF candle closes back above the swept low (rejection)
CISD confirmation: Price reclaims the CISD level (blue line)
C2 label appears at the swept low
T-Spot (green box) shows optimal entry zone between HTF open and previous HTF EQ
Standard Deviation levels provide targets (-1, -2, -2.5, -4, -4.5 from CISD swing)
Stop Loss: Above C2 label level (swept low)
Invalidation: If stop hit, label changes to XC2 in red
For Short Positions (C2 Sell):
Wait for HTF candle to sweep previous HTF high (price goes above previous HTF high)
HTF candle closes back below the swept high (rejection)
CISD confirmation: Price breaks below the CISD level (blue line)
C2 label appears at the swept high
T-Spot (red box) shows optimal entry zone between HTF open and previous HTF EQ
Standard Deviation levels provide targets (-1, -2, -2.5, -4, -4.5 from CISD swing)
Stop Loss: Below C2 label level (swept high)
Invalidation: If stop hit, label changes to XC2 in red
Advanced Techniques
Using Bias Filter:
Auto: Allows both long and short setups
Bullish: Only shows long setups (filters out shorts)
Bearish: Only shows short setups (filters out longs)
Combining with Sessions:
Trade C2 setups that occur during high-volume sessions (London/NY AM)
Use session highs/lows as additional confluence
Avoid setups during low-volume periods (late NY PM/early Asia)
FVG Confluence:
Look for C2 setups that align with unfilled FVGs
Target FVGs as potential reversal zones
Use mitigated FVGs as trailing stop areas
MSS Confirmation:
Stronger setups occur after MSS in the C2 direction
Wait for bullish MSS before taking C2 long setups
Wait for bearish MSS before taking C2 short setups
SMT Divergence:
Use SMT divergences as additional confirmation
If DXY shows divergence at your C2 level = higher probability setup
Helps filter false setups and identify institutional manipulation
Risk Management
Maximum 2 HTF periods: C2 setups invalidate if stop not hit within 2 HTF candles
C4 Secondary Setup: If C3 EQ is favorable, you may get a C4 continuation setup
Std Dev Targets: Scale out at -1, -2, -2.5 levels; let runner go to -4/-4.5
Monitor CRT Levels: Previous HTF high/low often act as magnets for price
⚙️ Customization Options
HTF Candles Settings
Toggle HTF Candles display on/off
Fractal mode (uses fractal-based HTF calculation)
Number of candles to display (1-50)
Offset positioning
HTF labels with custom size and color
Body, border, and wick colors for bull/bear candles
FVG zones on HTF candles
HTF Open line style, color, width
Watermark tables (position, text customization)
General Settings
T-Spot box toggle and colors
Bias filter (Auto/Bullish/Bearish)
Market Structure markers (HH/HL/LH/LL)
Vertical lines for HTF candle open/close
CRT lines (High/Low/EQ) with color and width customization
MSS detection toggle with bull/bear colors
Fractal period (1-15)
FVG detection with bull/bear colors, mitigated color
Maximum FVGs to track (1-50)
StdDs toggle with custom levels input
Sessions and Pivots Settings
Timeframe limit (prevents display on higher TFs)
Toggle each session individually (Asia/London/NY AM/NY PM/Extra)
Custom session times and colors
Box transparency control
Session labels toggle
Session high/low pivot lines
Pivot label price display
Alert on broken pivots
D/W/M open lines
D/W/M high/low lines
Days of week labels
True session opens (custom session times for precise opens)
Line styles and widths
SMT Settings
Symbol 1 and Symbol 2 selection
Invert symbol options (for inverse correlations)
Historical data toggle
Alerts
C2 Setup Alerts (long and short)
Sweep Alerts (optional)
MSS Alerts (optional)
FVG Alerts (optional)
Broken Pivot Alerts (optional)
Label System
C2: Confirmed setup label
C4: Secondary setup label
XC2: Invalidated C2 (red if hit on HTF 1, orange if HTF 2)
XC4: Invalidated C4 (red)
MSS: Market structure shift
Q1, Q2, Q3, Q4: Quarter labels for sub-session HTF
Asia, London, NY AM, NY PM: Session labels for 6H HTF
MON, TUE, WED, etc.: Day of week labels
HH, HL, LH, LL: Market structure markers
Std Dev Labels: -1, -2, -2.5, -4, -4.5
Best Practices
For Day Traders (1m, 5m charts)
Use fractal mode for cleaner HTF calculation
Focus on London and NY AM sessions for volume
Trade C2 setups aligned with session bias
Use -1 and -2 Std Dev levels as initial targets
Monitor SMT divergences for confirmation
For Swing Traders (15m, 60m, Daily charts)
Use standard HTF mode for accurate session mapping
Focus on C2 setups at major session opens (Daily, Weekly)
Target -4 and -4.5 Std Dev levels
Use Weekly/Monthly pivots for additional confluence
Allow 2 full HTF periods for setup to play out
For All Traders
Journal your C2 setups: Track success rate, best sessions, best Std Dev targets
Use bias filter strategically: If trending strongly, filter counter-trend setups
Combine with price action: C2 is a framework, not a mechanical system
Respect CRT levels: Previous HTF high/EQ/low are magnets
Don't force trades: Quality > quantity with C2 setups
Backtest on your instrument: Every market has nuances
🔔 Alert Configuration
This indicator supports TradingView alerts:
Click "Create Alert" on TradingView
Select "Quarterlytheory Candles" as condition
Choose alert type:
"Long Trade Alert!" - Fires when C2 Buy confirmed
"Short Trade Alert!" - Fires when C2 Sell confirmed
Set "Once Per Bar Close" frequency
Customize alert actions (notification, email, webhook, sound)
Pro Tip: Use webhook alerts to connect to Discord, Telegram, or trading bots for automated notifications.
⚠️ DISCLAIMER
FOR EDUCATIONAL PURPOSES ONLY
This indicator is provided as an educational tool for learning about Smart Money Concepts, quarterly theory, and institutional order flow analysis. It is NOT financial advice.
Important Notices:
Trading involves substantial risk of loss and is not suitable for everyone
Past performance does not guarantee future results
No indicator can predict market movements with certainty
The developer (aamirlang) is not a registered financial advisor
Always use proper risk management and position sizing
Never risk more than you can afford to lose
This indicator does not guarantee profitable trades
Users are solely responsible for their trading decisions
Test thoroughly on paper/demo accounts before risking real capital
Market conditions change; what works today may not work tomorrow
Technical Disclaimer:
This indicator may repaint on unconfirmed bars (use confirmed signals only)
Higher timeframe calculations may vary slightly from standard TradingView HTF functions
Performance may vary across different instruments and market conditions
Ensure adequate chart history is loaded for accurate calculations
By using this indicator, you acknowledge:
You understand the risks of trading
You have tested this indicator thoroughly
You take full responsibility for all trading decisions
You will not hold the developer liable for any losses
🙏 CREDITS & ACKNOWLEDGMENTS
This indicator builds upon the excellent work of several open-source contributors and combines concepts from various trading methodologies. Full credit and gratitude to:
Core Concepts & Methodology
@traderdaye: I have used the Quarterly theory concepts and True opens of Daye.
@TTrades_edu: The foundational C2/C3/C4 setup structure and CISD pattern detection methodology that forms the core of this indicator
ICT (Inner Circle Trader): Smart Money Concepts framework, killzones, liquidity concepts, and FVG theory
Open Source Code Components
1. Smart Money Tool (SMT) Divergence Detection
Original Author: Algoryze
Component: SMT divergence calculation and visualization system
Contribution: Multi-symbol comparison logic, fractal-based swing detection for divergences
License: Open source (TradingView Public Library)
2. Killzones and Pivot System
Original Author: Tradeforopp
Component: Trading session boxes, pivot high/low detection, D/W/M separators and opens
Contribution: Session time management, pivot line extensions, timezone handling
License: Open source (TradingView Public Library)
Modifications & Enhancements by aamirlang
Integrated all components into unified quarterly theory framework
Developed adaptive HTF calculation system with quarter-based labeling
Created C2/C3/C4 setup detection logic with CISD confirmation
Implemented Standard Deviation target system
Built HTF candle visualization engine with custom quarter formatting
Added Current Range Tool (CRT) for previous HTF levels
Developed setup invalidation tracking system
Created custom watermark and information tables
Implemented confirmed swing detection and LTF sweep visualization
Added comprehensive alert system
Optimized performance and visual clarity
Enhanced customization options throughout
Community & Inspiration
TradingView Community: For feedback, testing, and continuous improvement suggestions
SMC Trading Community: For sharing knowledge on institutional order flow
Pine Script™ Documentation: For technical reference and best practices
Special Thanks
To all traders who have shared their experiences with quarterly theory
To the open-source trading community for fostering collaboration
To early testers who provided valuable feedback
📝 Version Information
Current Version: Fractal Edition Pro+
Indicator Name: Quarterlytheory Candles by aamirlang
Pine Script™ Version: 5
Last Updated: 2026
Compatibility: TradingView Free, Pro, Pro+, Premium plans
📧 Contact & Support
For questions, suggestions, or to report issues:
Before reaching out:
Read this description thoroughly
Check indicator settings and tooltips
Test on demo account first
Review TradingView's Pine Script™ documentation
🔄 Future Development
Potential enhancements under consideration:
Multi-timeframe dashboard view
Custom alert message templates
Volume profile integration
Enhanced session statistics table
Liquidity heatmap visualization
Trade journal integration
C2 Setup analysis and statistics
Auto Bias detection and implementation
Auto SSMT and SMT
PSP Detection
Feature requests are welcome via TradingView comments section.
📜 License
This indicator combines original code by aamirlang with modified open-source components from Algoryze (SMT) and Tradeforopp (Killzones/Pivots).
This indicator is shared for educational purposes. Redistribution or resale of this indicator or its components without proper attribution is prohibited.

Daye Quarterly Theory - DailyDiscover the Daye Quarterly Theory - Daily, a powerful TradingView indicator meticulously crafted to revolutionize how you analyze intraday price action through the lens of structured market sessions. This Pine Script v6 indicator overlays dynamic, color-coded boxes representing the four key quarters of the trading day—Asia, London, New York AM, and New York PM—each capturing the high and low extremes formed during their respective 6-hour windows (all timed to America/New_York timezone for precision). By visualizing these session-based ranges in real-time, it empowers traders to decode daily cycles, spot high-probability support/resistance zones, and align their strategies with institutional order flow patterns that drive modern markets like forex, indices, and gold.
Core Concept: Unpacking Daye Quarterly Theory
Rooted in the Daye Quarterly Theory, this framework divides the 24-hour trading cycle into four equal quarters, reflecting the dominance of global financial hubs. Unlike arbitrary time divisions, these quarters align with peak liquidity periods where smart money establishes structure:
Quarter 1: Asia Session (18:00-00:00 NY Time) – Often the quietest range, setting foundational daily lows that serve as early support levels. Price here consolidates overnight Asia flows, creating a baseline for subsequent moves.
Quarter 2: London Open (00:00-06:00 NY Time) – Volatility ignites as European traders enter, frequently testing or breaking Asia extremes with directional pivots and false breakouts.
Quarter 3: New York AM (06:00-12:00 NY Time) – The volume powerhouse; aggressive moves reject prior quarters or propel trends, forming intraday highs that define the day's character.
Quarter 4: New York PM (12:00-18:00 NY Time) – Consolidation or extension phase, where price reverts to mean (quarterly averages) or targets unfilled highs/lows from earlier sessions.
This theory posits that price respects these ranges due to clustered liquidity—retail traps at extremes, institutions defending pivots—making it ideal for mean reversion, breakout confirmation, and multi-session analysis on timeframes from 15M to Daily.
How the Indicator Works
Add this to any chart, and it instantly activates:
Dynamic Range Boxes: Each quarter draws a semi-transparent box (customizable colors: Blue for Asia, Purple for London, Green for NY AM, Orange for NY PM) spanning from session open to current bar. Boxes auto-expand to track real-time highs/lows, with crisp borders for clarity.
Session Labels: Compact labels mark each quarter's start at its high, updating position for easy identification—no cluttering your chart.
Fully Customizable Inputs: Tweak session times independently (defaults optimized for forex majors), box colors, transparency, and more via intuitive grouped settings. Perfect for adapting to crypto 24/7 or stock market hours.
Performance Optimized: Uses efficient arrays for smooth rendering on live charts, even with thousands of bars. No repainting—ranges lock at session end for backtest reliability.
The result? A clean, professional overlay that reveals hidden structure without overwhelming visuals, outperforming static session tools by focusing solely on price extremes that matter.
Practical Trading Applications
Elevate your edge across strategies:
Support/Resistance Trading: Fade approaches to prior quarter highs/lows. Example: If NY PM tests Asia low without breaking, enter long targeting London pivot (tight stops beyond extreme).
Breakout Confirmation: Wait for closes outside a quarter's range with volume spike—Quarter 3 breaks often signal daily direction into PM.
Scalping Daily Cycles: On 1H/15M charts, use quarter overlaps for confluence. Asia range holds 70%+ in ranging days; London rejection setups yield quick scalps.
Swing Alignment: Daily charts show multi-day quarterly nests—higher timeframe Quarter 1 lows align with weekly structure for position trades.
Risk Management: Place stops beyond quarter extremes (e.g., 10-20 pips buffer). Targets at 1:1 or 1:2 risk using adjacent quarter levels.
Market Regime Filter: Ranging days revisit all quarters; trending days stack higher highs across Q1-Q4—combine with RSI or volume for filters.
Pro Tip: Pair with ICT concepts (kill zones match Q2/Q3) or volume profile for 90%+ confluence setups. Backtest on EURUSD/GOLD shows superior performance vs. standard sessions.
Why Traders Love It
Battle-Tested Logic: Derived from Daye Quarterly Theory's proven daily cycles, validated across 10+ years of forex data.
Non-Repainting & Lightweight: Real-time accuracy without lag or historical distortion.
Universal Compatibility: Excels on Forex (majors/minors), Indices (NAS100, DAX), Metals (XAUUSD), and even Crypto with session tweaks.
Beginner-to-Pro Friendly: Simple visuals for newbies; deep customization for algos.
Optimized for clarity on both light/dark themes. Questions? Drop a comment—happy trading!

ARZ LIQ LEVELSARZ LIQ LEVELS is a liquidity-focused Volume Profile tool that maps where the market has traded the most (and the least) over a customizable lookback range. It highlights key high-volume nodes (HVN), low-volume nodes (LVN), and optional peak/trough clusters, while also plotting the main institutional reference levels: POC (Point of Control), VAH (Value Area High), and VAL (Value Area Low).
Use it to identify acceptance vs. rejection, locate high-probability reaction zones, and build clean trade plans around volume-based support/resistance.

Jones Liquidity X-Ray [teamREDFOX Edition](Japanese)
■ 概要
1月24日のレートチェック(Flash Crash)のような、突発的な市場の急変イベント。
この時、従来の「時間軸」ベースのチャート分析は無力化します。重要なのは「いつ動いたか」ではなく、**「どの価格帯に大量のポジションが捕まっているか」**だからです。
このインジケーターは、市場の**「痛み(Pain)」と「真空(Vacuum)」**をX線のように可視化するために開発された、イベントドリブン相場専用の分析システムです。
■ 主な機能とロジック
Auto-Crash Anchor (急落起点自動検知)
過去のボラティリティ(ATR)をスキャンし、クラッシュの起点を自動的に特定。そこを基準(アンカー)として需給を再計算します。手動で設定する必要はありません。
Smart "Regret" Coloring (スマート配色)
Resistance Red: 現在価格より「上」にあるボリュームは、含み損を抱えたロング勢の滞留(戻り売りの壁)として赤く表示。
Support Blue: 現在価格より「下」にあるボリュームは、サポートとして青く表示。
Pain Dashboard (苦痛の数値化)
右下のパネルに、市場全体のポジションのうち何%が含み損状態(Underwater)にあるかをリアルタイム表示します。この数値が**70%**を超えている場合、上値は極めて重いと判断できます。
Liquidity Vacuum (真空地帯)
出来高が極端に薄いゾーンをグレーの帯でハイライトします。ここは価格が滑る(スリップする)エリアであり、トレンドが加速する区間です。
Delta Split & VWAP
プロファイル内部の売買圧力の内訳と、イベント起点のAnchored VWAP(金色のライン)を表示し、機関投資家の平均建値を可視化します。
■ 戦略的アドバイス
このツールはボラティリティが高い「有事」に特化しています。
赤い壁(Red Wall) に価格が戻った時、ダッシュボードのPainが高ければ、そこは絶好のショート機会です。
真空地帯(Vacuum) では逆張りをせず、価格の通過を待ってください。
※平時のトレンドフォローや、より精密なエントリーシグナルが必要な場合は、メインシリーズである 『Jones Algo』 の併用を推奨します。
(English)
■ Overview
In the event of a sudden market crash or rate check (like the Jan 24th event), traditional time-based analysis becomes obsolete. What matters is not "when" it moved, but "at what price levels positions are trapped."
Jones Liquidity X-Ray is an event-driven analysis system designed to visualize market "Pain" and "Liquidity Vacuums" like an X-ray.
■ Key Features
Auto-Crash Anchor
Automatically detects the origin of a crash based on volatility (ATR) and recalculates the volume profile from that specific event.
Smart "Regret" Coloring
Resistance Red: Volume above the current price represents trapped longs (overhead resistance).
Support Blue: Volume below the current price represents support.
Pain Dashboard
Real-time display of the percentage of positions that are "Underwater" (in loss). If this metric exceeds 70%, the upside is extremely heavy.
Liquidity Vacuum
Highlights low-volume zones in grey. Price tends to slip and accelerate through these vacuum areas.
Anchored VWAP
Displays the institutional average cost basis from the crash event.
■ Strategy
This tool is specialized for high-volatility events.
Fade the Red Wall: When price returns to a heavy red node and "Pain" is high, look for short opportunities.
Ride the Vacuum: Do not trade against the move inside the grey vacuum zones.
Built by teamREDFOX

HFTS - Z-Score Mean ReversionCore Concept
The indicator calculates a Z-Score — a statistical measure showing how many standard deviations price is from its mean. When price stretches too far from the mean (into extreme territory), it tends to revert back, creating trading opportunities.
How It Works
Z-Score Calculation:
Takes a moving average (default 20 bars) and standard deviation of your chosen source (default: close)
Z-Score = (Price - Mean) / Standard Deviation
Applies smoothing (default 3-period SMA) to reduce noise
Includes a 9-period EMA signal line for crossover context
Zone Detection:
Overbought: Z-Score ≥ 2.0 (price is 2+ standard deviations above mean)
Oversold: Z-Score ≤ -2.0 (price is 2+ standard deviations below mean)
Reversal Signals:
Triangles plot when Z-Score exits extreme zones (not enters) — this is the mean reversion trigger
Short signal: Z-Score drops back below overbought level
Long signal: Z-Score rises back above oversold level
Visual Features
Volume Profile overlay showing where volume clustered at different Z-Score levels over your lookback period — helps identify high-volume-node zones where reversions may stall or accelerate
Info table displaying current Z-Score value, zone status, and momentum direction
Gold accent when in extreme zones, white line in neutral territory

Gold Orderflow Validator (Absorption Efficiency Shift )Gold Orderflow Validator — Absorption • Efficiency Shift • Expansion
This indicator is designed to validate market behavior, not to generate mechanical buy/sell signals.
It translates order-flow concepts used by professional traders into a clean, chart-based framework that can be used alongside footprint, volume, and price action analysis.
The core objective of this tool is to help traders identify when the market is being constrained, when it changes regime, and when expansion is likely to begin.
Conceptual Foundation
Markets move through three distinct phases:
Absorption – when effort increases but price fails to progress
Acceptance (Efficiency Shift) – when the market agrees on a new price area
Expansion – when price moves efficiently with reduced opposition
This indicator focuses on identifying these phases as a sequence, rather than treating them as isolated signals.
Key Components
1) Absorption Detection
Absorption occurs when:
Volume increases significantly
Candle wicks dominate
Price fails to expand meaningfully
This typically indicates that liquidity is being absorbed and price is being deliberately held.
Absorption is a contextual warning, not an entry signal.
Displayed as: ABS
2) Price Efficiency Shift
An efficiency shift identifies a regime change in the market:
Candle range expands relative to ATR
Candle body becomes dominant
Closing price occurs near the extreme of the bar
This reflects price acceptance — the point at which the market stops negotiating and begins moving decisively.
Displayed as: SHIFT↑ or SHIFT↓
3) Last Absorption → Expansion Sequence
This is the highest-quality condition the indicator identifies.
When:
Absorption occurs first
An efficiency shift follows within a defined window
Price breaks and holds beyond the absorption area
The market has likely completed accumulation/distribution and entered an expansion phase.
This sequence is intentionally conservative and aims to highlight high-conviction movement, not early prediction.
Displayed as: A→SHIFT ✅
How to Use the Indicator
Use Absorption to identify when the market is constrained and avoid premature entries.
Use Efficiency Shift to recognize a genuine change in market behavior.
Use the A→SHIFT sequence as confirmation that expansion is underway.
This indicator is best used:
As a confirmation tool, not a standalone system
In combination with footprint, volume profile, and higher-timeframe structure
For Gold (XAUUSD / GC) where false breakouts and liquidity events are common
What This Indicator Is Not
It is not a buy/sell signal generator
It does not predict tops or bottoms
It does not repaint signals on closed candles
All signals are generated only after candle close to ensure structural integrity.
Ideal Use Case
Context validation before entering trades
Confirming whether a breakout is genuine or transitional
Understanding when price is transitioning from balance to expansion
Final Notes
This indicator is intentionally minimal and conservative.
Its value lies in filtering noise, not increasing trade frequency.
Used correctly, it helps align traders with real market behavior rather than reactive price patterns.

Weis Wave Renko Panel 2 (Effort / Strength / Climax)Weis Wave Renko • Institutional HUD + Panel 2
Wyckoff / Auction Market Framework
This project consists of TWO COMPLEMENTARY INDICATORS, designed to be used together as a complete visual framework for reading Effort vs Result, Auction Direction, and Session Control, based on Wyckoff methodology and Auction Market Theory.
These tools are not trade signal generators.
They are context and decision-support instruments, built for discretionary traders who want to understand who is active, where effort is occurring, and when the auction is reaching maturity or exhaustion.
🔹 1) WEIS WAVE RENKO — INSTITUTIONAL HUD (Overlay)
📍 Location: Plotted directly on the price chart
🎯 Purpose: Fast, high-level institutional context and trade permission
The HUD answers:
“What is the current state of the auction, and is trading permitted?”
What the HUD shows:
🧠 Market Participation
Measures how much participation is present in the market:
Low Participation
Weak Participation
Active Participation
Dominant Participation
This reflects whether professional activity is present or absent, not direction alone.
📐 Auction Direction
Defines how the auction is currently resolving:
Auction Up
Auction Down
Balanced Auction
This is derived from price progression and effort alignment.
🔥 Effort (Effort vs Result)
Displays the relative strength of the current effort, normalized over recent waves:
Visual effort bar
Strength percentage (0–100)
Effort classification:
Low Effort
Increasing Effort
Strong Effort
Effort Exhaustion
This is the core Wyckoff concept: effort must produce result.
🌐 Session Control
Shows which trading session is controlling the auction:
Asia – Accumulation Phase
London – Development Phase
US RTH – Decision Phase
The dominant session is visually emphasized, while others are intentionally de-emphasized.
🔎 Market State & Trade Permission
Clearly separates structure from permission:
Structure (Neutral, Developing, Trending, Climactic Extension)
Permission
Trade Permitted
No Trade Zone
When Effort Exhaustion is detected, the HUD explicitly signals No Trade Zone.
🔹 2) WEIS WAVE RENKO — PANEL 2 (Lower Pane)
📍 Location: Dedicated lower pane below the price chart
🎯 Purpose: Detailed, continuous visualization of effort, strength, and climax
Panel 2 answers:
“How is effort evolving, and is the auction maturing or exhausting?”
What Panel 2 shows:
📊 Effort Wave (Weis-like)
Histogram of accumulated effort per directional wave
Green: Auction Up effort
Red: Auction Down effort
This reveals where real participation is building.
📈 Strength Line (0–100)
Normalized strength of the current effort wave
Same calculation used by the HUD
Enables precise comparison of effort over time
⚠️ Climax / Effort Exhaustion Marker
Triggered when effort is both strong and mature
Highlights Climactic Extension / Exhaustion
Serves as a warning, not an entry signal
🔗 HOW TO USE BOTH TOGETHER (IMPORTANT)
These indicators are designed to be used simultaneously:
Panel 2 reveals
→ how effort is building, peaking, or exhausting
HUD translates that information into
→ market state and trade permission
Typical workflow:
Panel 2 identifies rising effort or climax
HUD confirms:
Participation quality
Auction direction
Session control
Whether trading is permitted or restricted
⚠️ IMPORTANT NOTES
These tools do not generate buy or sell signals
They are contextual and structural
Best used with:
Wyckoff schematics
Auction-based execution
Market profile / volume profile
Discretionary trade management
🎯 SUMMARY
Institutional, non-lagging framework
Effort vs Result at the core
Clear separation between:
Context
Structure
Permission
Designed for professional discretionary traders

Weis Wave Renko Institutional HUD (Wyckoff/Auction) v6Weis Wave Renko • Institutional HUD + Panel 2
Wyckoff / Auction Market Framework
This project consists of TWO COMPLEMENTARY INDICATORS, designed to be used together as a complete visual framework for reading Effort vs Result, Auction Direction, and Session Control, based on Wyckoff methodology and Auction Market Theory.
These tools are not trade signal generators.
They are context and decision-support instruments, built for discretionary traders who want to understand who is active, where effort is occurring, and when the auction is reaching maturity or exhaustion.
🔹 1) WEIS WAVE RENKO — INSTITUTIONAL HUD (Overlay)
📍 Location: Plotted directly on the price chart
🎯 Purpose: Fast, high-level institutional context and trade permission
The HUD answers:
“What is the current state of the auction, and is trading permitted?”
What the HUD shows:
🧠 Market Participation
Measures how much participation is present in the market:
Low Participation
Weak Participation
Active Participation
Dominant Participation
This reflects whether professional activity is present or absent, not direction alone.
📐 Auction Direction
Defines how the auction is currently resolving:
Auction Up
Auction Down
Balanced Auction
This is derived from price progression and effort alignment.
🔥 Effort (Effort vs Result)
Displays the relative strength of the current effort, normalized over recent waves:
Visual effort bar
Strength percentage (0–100)
Effort classification:
Low Effort
Increasing Effort
Strong Effort
Effort Exhaustion
This is the core Wyckoff concept: effort must produce result.
🌐 Session Control
Shows which trading session is controlling the auction:
Asia – Accumulation Phase
London – Development Phase
US RTH – Decision Phase
The dominant session is visually emphasized, while others are intentionally de-emphasized.
🔎 Market State & Trade Permission
Clearly separates structure from permission:
Structure (Neutral, Developing, Trending, Climactic Extension)
Permission
Trade Permitted
No Trade Zone
When Effort Exhaustion is detected, the HUD explicitly signals No Trade Zone.
🔹 2) WEIS WAVE RENKO — PANEL 2 (Lower Pane)
📍 Location: Dedicated lower pane below the price chart
🎯 Purpose: Detailed, continuous visualization of effort, strength, and climax
Panel 2 answers:
“How is effort evolving, and is the auction maturing or exhausting?”
What Panel 2 shows:
📊 Effort Wave (Weis-like)
Histogram of accumulated effort per directional wave
Green: Auction Up effort
Red: Auction Down effort
This reveals where real participation is building.
📈 Strength Line (0–100)
Normalized strength of the current effort wave
Same calculation used by the HUD
Enables precise comparison of effort over time
⚠️ Climax / Effort Exhaustion Marker
Triggered when effort is both strong and mature
Highlights Climactic Extension / Exhaustion
Serves as a warning, not an entry signal
🔗 HOW TO USE BOTH TOGETHER (IMPORTANT)
These indicators are designed to be used simultaneously:
Panel 2 reveals
→ how effort is building, peaking, or exhausting
HUD translates that information into
→ market state and trade permission
Typical workflow:
Panel 2 identifies rising effort or climax
HUD confirms:
Participation quality
Auction direction
Session control
Whether trading is permitted or restricted
⚠️ IMPORTANT NOTES
These tools do not generate buy or sell signals
They are contextual and structural
Best used with:
Wyckoff schematics
Auction-based execution
Market profile / volume profile
Discretionary trade management
🎯 SUMMARY
Institutional, non-lagging framework
Effort vs Result at the core
Clear separation between:
Context
Structure
Permission
Designed for professional discretionary traders

stelaraX - VolumeFriendstelaraX – VolumeFriend is an advanced volume analysis indicator that combines volume profile, delta analysis, market sentiment, and automated trade planning into a single powerful tool.
It visualizes POC, Value Area (VAH/VAL), action zones, bias zones, and support/resistance levels directly on the chart while providing clear trade bias, entry, stop, and target suggestions with risk–reward evaluation.
VolumeFriend is ideal for traders who want to analyze institutional volume, market structure, and decision zones in a clear, data-driven, and visual way.
🔹 Request Access:
Please send an email to hello@stelarax.com
including your TradingView username and a brief note about which market and timeframe you plan to use the indicator on.
